In this guide we’ll look at reports that consolidate assessments from a variety of sources. The first example below is the same one as used in the explanation of consolidated topic reports. The project manager of the Columbus project has invited a team member and a stakeholder to share their assessments. These appear on the assessments overview page as shown below:

The consolidated report is accessed by clicking on the report icon on the right.
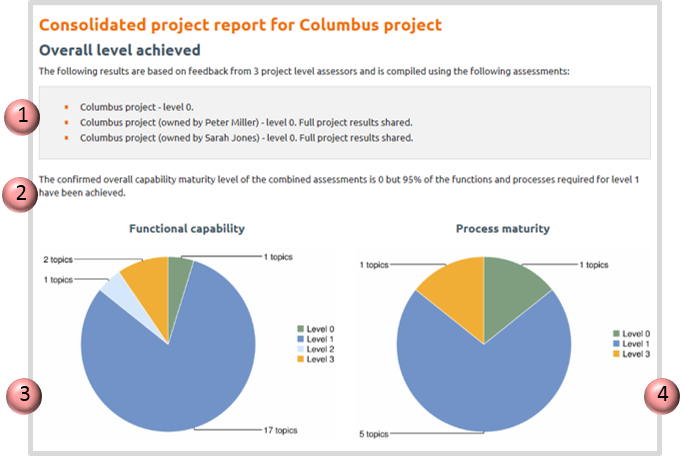
The report starts off by explaining the overall level that the project, programme or portfolio has achieved. It then goes on to provide detail about the functional capabilities and the process maturities.
Finally, you can see how this project, programme or portfolio rates against the database as a whole and those assessments with the same context.
In this example the Columbus project has three assessments.
-
The first is by the Columbus project manager, John Haines who has rated the project at level 0. John has invited Peter Miller and Sarah Jones to contribute their assessments. Both contributors have also rated the project at level 0.
-
The overall level of the project is confirmed at level 0 but it’s not all bad news as the project is 95% of the way to being at level 1.
-
The functional capability pie chart shows that only one function is at level 0 and all others are rated at level 1 or above. In fact one function has achieved level 2 and another two functions have achieved level 3.
-
The process maturity pie chart reveals that one of the process maturities is rated at level 0, while all the others are level 1 or above.
It seems that there is one function and one process causing the project to be at level 0.
Before looking at this in more detail, let’s just look at the opening part of a consolidated full report for a programme and its component projects. In the example below Sarah Jones has assessed the Magellan programme and asked Peter Miller to contribute his assessment of the programme.
She has also invited John Haines to contribute two projects that are part of the programme: Columbus and Shackleton.
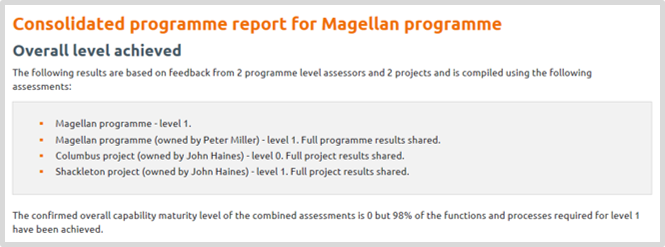
Click here for more about consolidation principles.The opening part of the report shows that while the management of the programme is rated as level 1 by both assessors, the programme as a whole is rated at level 0 purely because of project Columbus. If the Columbus project can achieve level 1, the Magellan programme will immediately achieve level 1 as well.
We saw previously that all but one of the functions in the Columbus project have achieved level 1 or above. The next section of the report shows the level achieved for each function.
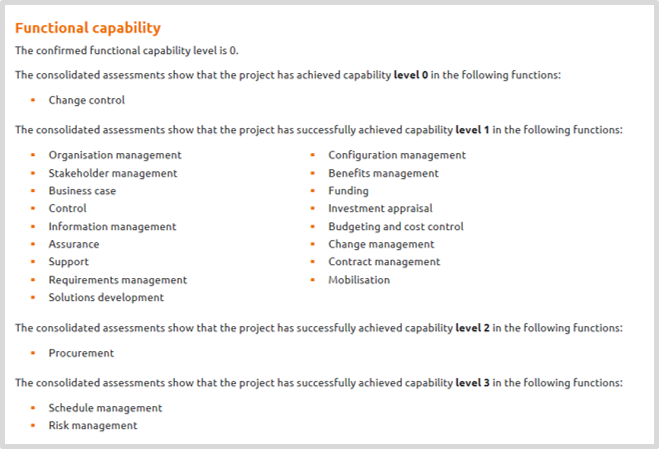
This reveals which function needs to be addressed to get to level 1. It also shows that we have a lot of work to do to get the project to level 2.
As far as processes are concerned, the next section shows that the focus needs to be on sponsorship.
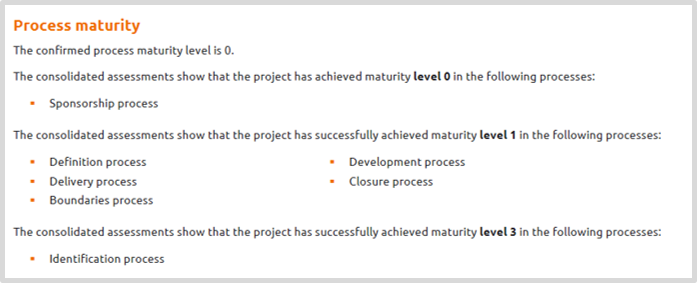
If we can improve change control and sponsorship the project will achieve level 1 (and so will the Magellan programme).
The final section of the report shows how this project compares to projects in the database with the same context and all projects in the database. Firstly for the functional capabilities and secondly for the process maturities.
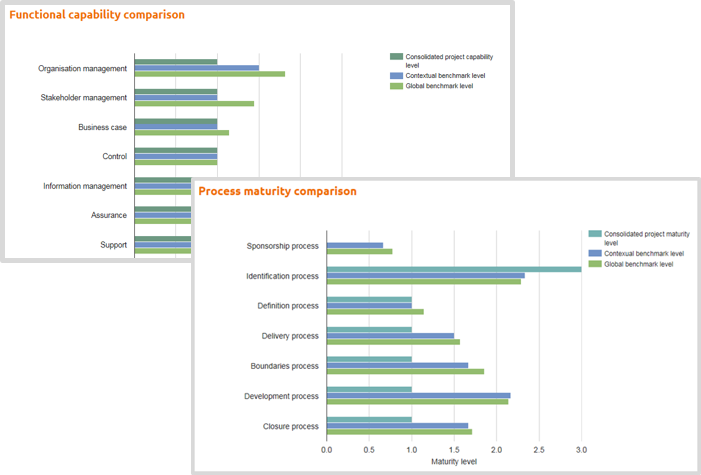
The ‘global benchmark level’ relates to all assessments on the database. The ‘contextual benchmark level’ relates to assessments that have the same context profile. The context is defined when creating an assessment.
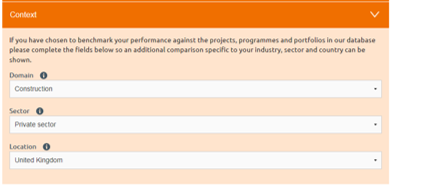 You don’t have to complete all three context fields but any you do complete will be used to match assessments for the contextual comparison.
For example, if you were to amend the settings for Columbus so that the ‘Sector’ was not defined, the comparison would be for all UK construction projects regardless of sector.
If ‘Location’ was not defined, the comparison would be for all construction projects worldwide.

