Projects and programmes often have to deal with complexity. This may be because the objectives of the work are complex and/or because the work is operating in a complex environment. Understanding that complexity is vital for the success of the project or programme.
A causal loop diagram is a tool used to describe a complex system. It is usually described in the context of Systems Thinking.
Humans have evolved to well understand simple cause and effect. If I touch a flame it will cause pain, so I don’t touch flames.
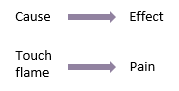
As a result of understanding this simple cause and effect, I’m able to avoid the pain of being burnt.
In other situations, the relationships are often two way. For example, if the balance in a bank account earns interest and the interest is added to the balance, the result is more interest, and so on.

In a causal loop diagram. This relationship is shown in this way:

Importantly, the ‘+’ signs do not indicate that the interest is ‘added’ to the balance, or the balance is ‘added’ to the interest. They mean that the two things move in the same direction, as interest goes up, so does the balance. For that reason, ‘s’ is sometimes used instead of ‘+’ to indicate ‘same direction’. The ‘R’ symbol within the loop indicates that this is a ‘reinforcing loop’.
Another simple example is that of a thermostat.
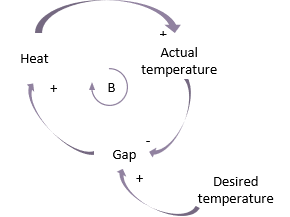
In this case, a desired temperature is set, for example in an oven. The higher the desired temperature the bigger the gap with the ambient temperature. These factors move in the same direction and so are labelled with a ‘+’. The gap causes the oven to create heat which raises the actual temperature.
The relationship between the actual temperature and the gap is different. They go in opposite directions – as the actual temperature increases the gap decreases. This is therefore labelled with a minus sign (or an ‘o’ to indicate ‘opposite directions’).
The effect is that the system strives to reach the goal of the desired temperature. It is referred to as a ‘balancing loop’ and is indicated by the ‘B’ symbol.
It’s useful to understand the behaviour of these systems over time:
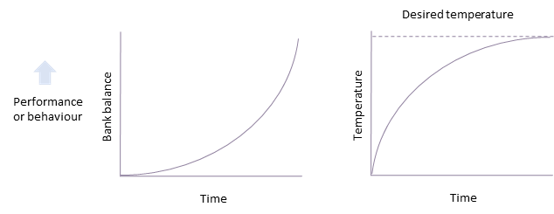
Over time, a reinforcing loop will increase exponentially, while a balancing loop will seek the goal and plateau at that level.
As part of systems thinking, causal loop diagrams are useful as the extent and uncertainty of scope increases.
While causal loop diagrams are useful in complicated projects and programmes, they really come into their own in complex situations where cause and effect are difficult to understand. This would be particularly true in programmes of business change.
The next example starts with a situation that can be complicated but not initially complex.

Births and death obviously have an effect on a population. As births increase, population increases; as population increases, births increase. Population and births move in the same direction and this is a reinforcing loop.
Conversely, as population increases, deaths increase. As death increases, then population decreases (these move in opposite directions). This is a balancing loop.
However, as population increases there is a delay before births increase because people have to reach reproductive maturity. Similarly, as population increases, there is a delay before deaths increases.
These delays are shown by short parallel lines on the corresponding arrows. In the diagram below, the delays have been added and the two loops have been brought together.

Of course, human populations cannot be understood by this simple combination of births and deaths. There are many other factors at play.
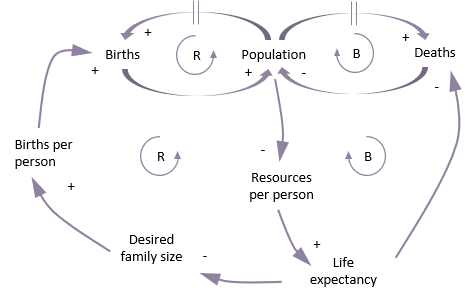
For example, as populations increase in a developing economy, they may have access to fewer resources per person (food, jobs, health care etc.). This has an impact on life expectancy and desired family size. These factors loop round into the original two birth and death factors that affect population. They create another reinforcing loop and another balancing loop.
It’s worth noting here that if you trace any loop, an even number of minuses creates a reinforcing loop and an odd number of minuses creates a balancing loop.A diagram such as this is heavily dependent upon context (in this case a developing economy), and will incorporate assumptions or justifiable propositions depending upon the data available.
These examples constitute a brief introduction to causal loop diagrams. As part of systems thinking, they can be used to model complex systems. This may be the system that is an outcome of a project or programme, or it may be the organisational system that is in place to deliver the objectives.


