Critical path analysis is a time scheduling technique for analysing a network diagram. It calculates dates when activities in the network should occur and identifies flexibility in the performance of some activities.
The two important limitations of critical path analysis are that:
- only one estimated duration is used for each activity;
- the technique makes no allowances for resource availability.
The calculation comprises three phases:
- forward pass;
- backward pass;
- float calculations.
The forward pass calculates the earliest times when activities can occur and the backward pass calculates the latest times. The difference between the two indicates the degree of flexibility there is in the performance of the activity and this is quantified as float.
Using a computer, the model as represented by the network diagram, can be adjusted and these calculations repeated time and time again. This allows different situations to be tested in what is often called ‘what-if’ analysis.
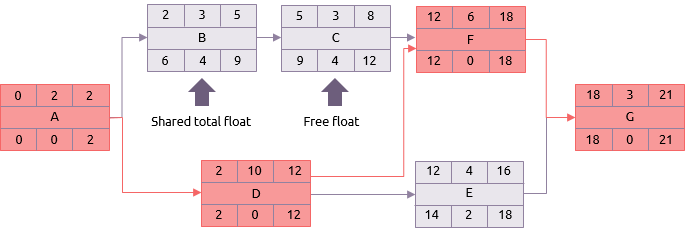
Each activity in the network diagram will have seven basic elements:
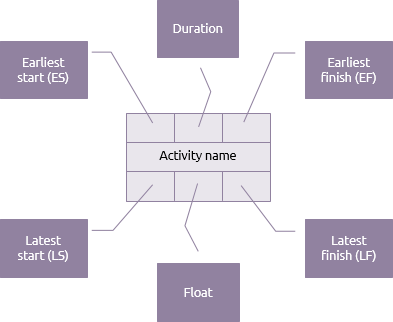
The duration is the time required to complete the activity. The upper dates will indicate the earliest time the activity could be performed and the lower dates will indicate the latest time the activity could be performed.
The forward pass:
The forward pass then starts by placing 0 as the earliest start of activity A. Since its duration is 2 days its earliest finish is day 2. If A is finished by day 2 then that is the earliest start of B and D, and so the calculation continues.
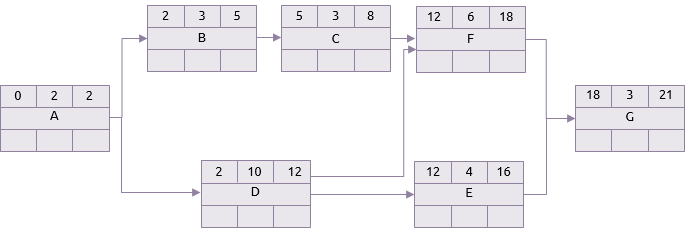
The next point to note is activity F. This activity has two predecessors C and D. C’s earliest finish is 8 but D’s is 12. Therefore the earliest time that F can start is day 12.
Following the calculation to its conclusion the earliest finish for G (and therefore the project) is 21 days.
The backward pass:
The earliest finish for the project is assumed to also be its latest finish. The process is then repeated, but in reverse.
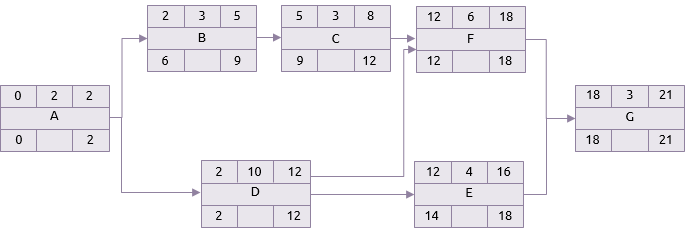
If G’s latest finish is day 21, and it takes 3 days, its latest start is therefore, day 18. This means that F and E must be finished by day 18 at the latest.
E’s latest start is 14 and therefore D, perhaps, has a latest finish of 14. But D also has to be complete in time for F to start. The latest start of F is 12 and hence D has a latest finish of 12.
The same principle applies to A. Even though B doesn’t have to start until 6, A must be finished by 2 because that is the latest time D can start.
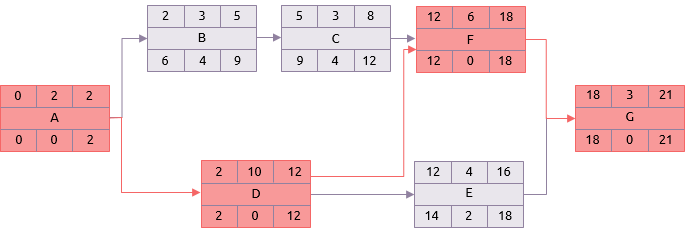
Float calculations:
The last phase is the simplest. If there is a difference between the earliest and latest times that an activity can be done, it must have a degree of flexibility. This is calculated by first taking the earliest start from the latest finish. The result is the time available to perform the activity. By deducting the time required to perform the activity (i.e. the duration) from the time available, the total float (or ‘total slack’) is calculated.
For example, on activity B:
Time available = latest finish – earliest start (9 - 2)
Therefore the time available is 7 days.
Total float = time available – duration (7 – 3)
Therefore activity B has 4 days total float, i.e. it could be delayed or extended by 4 days without extending the network finish date of 21 days.
On some activities the result will be 0.
E.g. activity D.
Float = Latest finish – earliest start – duration (12-2-10)
These are the critical activities and the sequence of these from the first to last activities is the critical path. In the sample network that is:
A-D-F-G.
The critical path is the longest path through the network and has the least float (usually 0).
In this simple example there is a single critical path with zero float i.e. there is a sequence of activities with no flexibility. From a managerial point of view there will inevitably be many activities with small amounts of flexibility that also need close attention when controlling the project.
In the example the focus will be on, A, D, F and G, because they have no flexibility. But E has only 2 day’s float and also needs to be watched carefully.
There are two aspects of float that we need to look at more closely. These are demonstrated by activities B and C.
-
Shared total float:
If B is delayed at all, it will have an immediate knock on effect on C. This is normally just referred to as total float, although it would be more accurate to qualify it as ‘shared’ total float.
-
Free float:
Free float is the amount by which an activity can be delayed without affecting any subsequent activities. Activity C can be delayed by up to 4 days without having any knock on effect because F cannot start until day 12 anyway.
The example network uses only finish-to-start dependencies. The use of other types of network diagram dependencies make the calculation slightly more complex and can lead to activities having different amounts of float at their start or finish. This is most noticeable in the analysis of ladders.
The start and finish dates of activities are sometimes subject to constraints other than the internal logic of the network diagram. These are represented by imposed dates.
Further enhancements, mainly for clarity when presenting the results of critical path analysis in a Gantt chart, are the use of milestones and hammocks.
The limitations of critical path analysis with respect to the use of a single estimate of duration are addressed in techniques such as PERT and Monte Carlo analysis. The limitations with regard to resource availability are addressed in extensions to the technique such as critical chain and resource limited scheduling.


