PERT is an acronym for Program Evaluation and Review Technique, from the time when the term program represented the schedule of a project rather than a programme of projects and business change.
Critical path analysis uses a single point estimate for all activity durations. In reality it is unlikely that durations can be estimated with that degree of certainty. PERT uses a three point estimate for each activity. The three estimates are known as:
- Optimistic (very unlikely that the task will take shorter than this);
- Pessimistic (very unlikely that the task will take longer than this);
- Most likely (this is what we really think it will take).
The table below shows seven activities with optimistic, most likely and pessimistic durations.
Task | Optimistic | Most likely | Pessimistic |
|---|---|---|---|
| A | 2 | 2 | 8 |
| B | 4 | 5 | 12 |
| C | 7 | 8 | 15 |
| D | 10 | 14 | 18 |
| E | 6 | 7 | 14 |
| F | 7 | 9 | 17 |
| G | 2 | 3 | 10 |
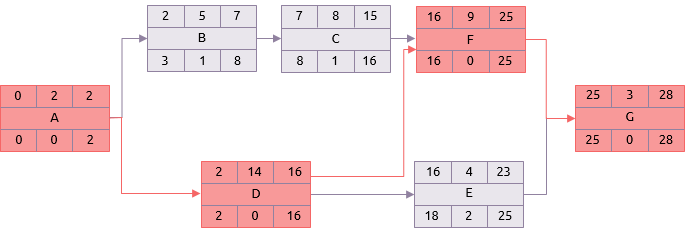
Using the most likely durations in a normal critical path analysis gives the result shown below with the critical path being the sequence: A, D, F, G.
However, activities will actually take somewhere between the optimistic and pessimistic estimates. PERT uses these estimates to calculate a mean duration based on a Beta distribution.

Or to show it more formally:

For example, activity B is most likely to take 5 days, but there is a possibility that it could be done in 4 days or there could be problems causing it to take as long as 12 days.
Its mean duration is therefore:

An extended table showing the mean durations for each activity is shown below:
Task | Optimistic | Most likely | Pessimistic | Mean |
|---|---|---|---|---|
| A | 2 | 2 | 8 | 3 |
| B | 4 | 5 | 12 | 6 |
| C | 7 | 8 | 15 | 9 |
| D | 10 | 14 | 18 | 14 |
| E | 6 | 7 | 14 | 8 |
| F | 7 | 9 | 17 | 10 |
| G | 2 | 3 | 10 | 4 |
Using the mean durations in the analysis instead of the most likely estimates gives a different result.
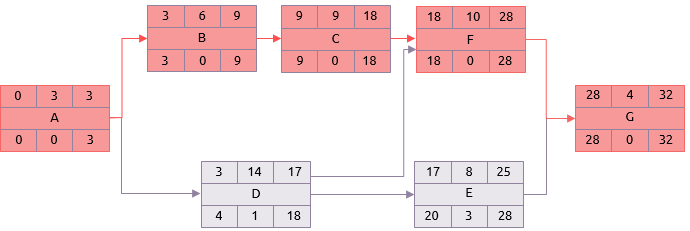
Not only has the overall project duration increased to 32, but the critical path has moved. It now comprises tasks A, B, C, F and G.
Even though PERT uses three estimates, and is therefore likely to give a more realistic result, it still provides only a single result for the project’s overall duration. This result lies on a normal distribution and the standard deviation (represented by the letter sigma) is used to estimate the likelihood of a range of project finish dates.
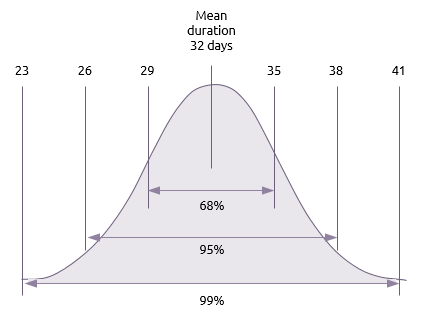
- 68% (One-sigma)
-
There is a 68% chance (68.27 to be precise) that the project will take between plus or minus one standard deviation from the mean, i.e. between 32 – 3 (29 days) and 32 + 3 (35 days).
- 95% (Two-sigma)
-
There is a 95% chance (95.45 to be precise) that the project will take between plus or minus two standard deviations from the mean, i.e. between 32-3-3 (26 days) and 32+3+3 (38 days).
- 99% (Three-sigma)
-
There is a 99% chance (99.73 to be precise) that it will take between plus or minus three standard deviations from the mean, i.e. between 32-3-3-3 (23 days) and 32+3+3+3 (41 days).
Exactly the same principle may be used to deal with estimated ranges of cost rather than duration. PERT/Cost uses three estimates of the cost of each activity to calculate a mean cost for each task. The mean total project cost is then the sum of all the activity mean costs not just those on the critical path.
PERT was designed when computing power was at a premium. This type of probabilistic analysis is now normally performed using Monte Carlo analysis.


