Resource allocation identifies what resources are needed to complete activities and critical path analysis calculates when the activities can be performed. Combining these two sets of data allows the demand for each type of resource to be aggregated over time. This information is typically represented as a resource histogram.
The diagram below illustrates a number of activities on a Gantt chart. The numbers represent the amount of a specific resource required each day. The numbers are summed and shown graphically at the bottom of the diagram as a histogram.
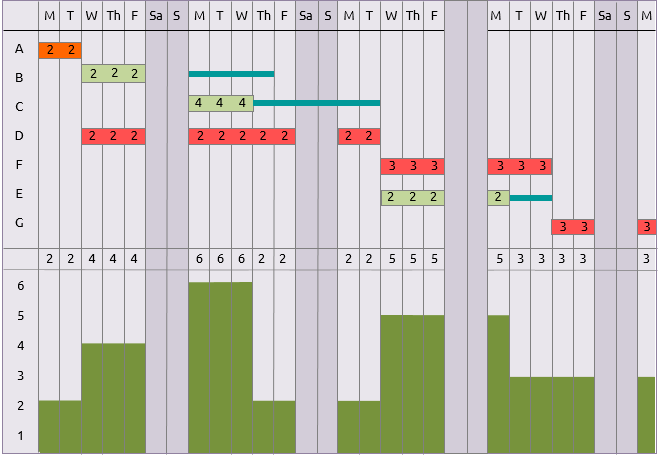
Representing resource usage in this way highlights the peaks and troughs of demand. Such fluctuations are inefficient and costly so resource limited scheduling is used to even out the demand by rescheduling activities.
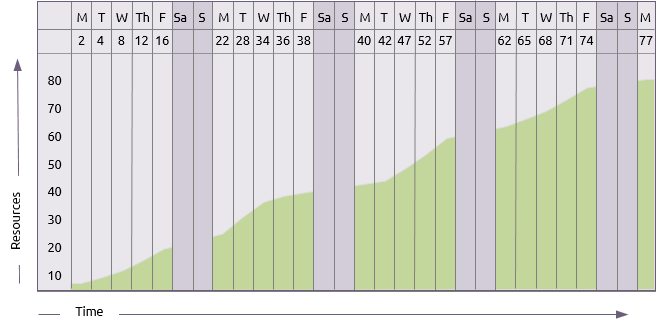
Histograms can also show cumulative resource usage. The graphical presentation then shows the increasing consumption of resource throughout the project. This format is more appropriate to consumable resources such as materials and can assist with scheduling materials delivery and estimating optimum stock levels.