Henry Gantt was an American engineer working at the Frankford Arsenal in the early part of the 20th century. In 1917 he developed the Gantt Chart which still bears his name today.
Also known as a bar chart, the Gantt Chart simply shows bars on a horizontal time scale. The basic format is applicable at all levels in the P3 environment. At the project level, the bars represent activities; at programme level they primarily represent projects and at a portfolio level they primarily represent projects and programmes.
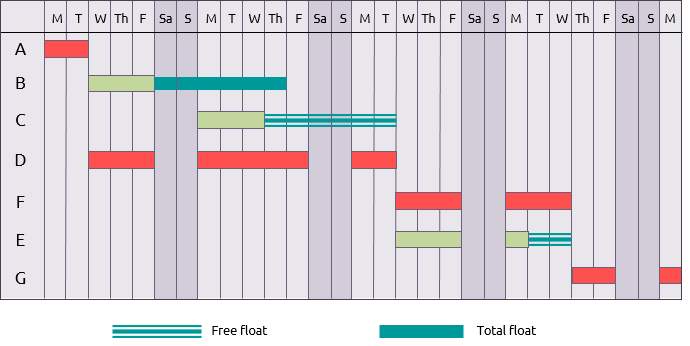
On the simplest of projects it may be sufficient to schedule activity simply by drawing a Gantt Chart but on most projects the chart would be showing the results of critical path analysis, including highlighting critical activities and float.
The basic format can be enhanced in the form, for example, of linked bar charts and slip charts.
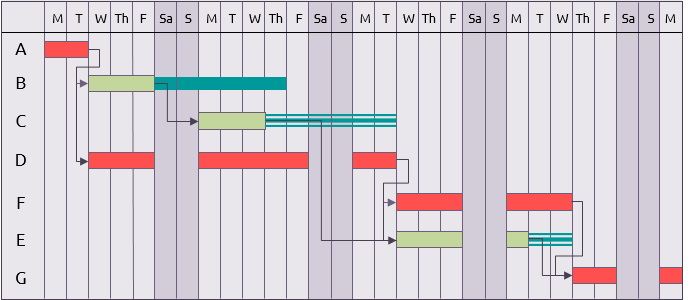
Linked bar charts
These show the dependencies between activities as well as the activity bars. This is the primary way of creating a network in most modern scheduling programs (as opposed to a network diagram) but can get messy with large complex networks.
Slip charts
Also known as progress charts or baseline charts, these show the current forecast against the original baseline.
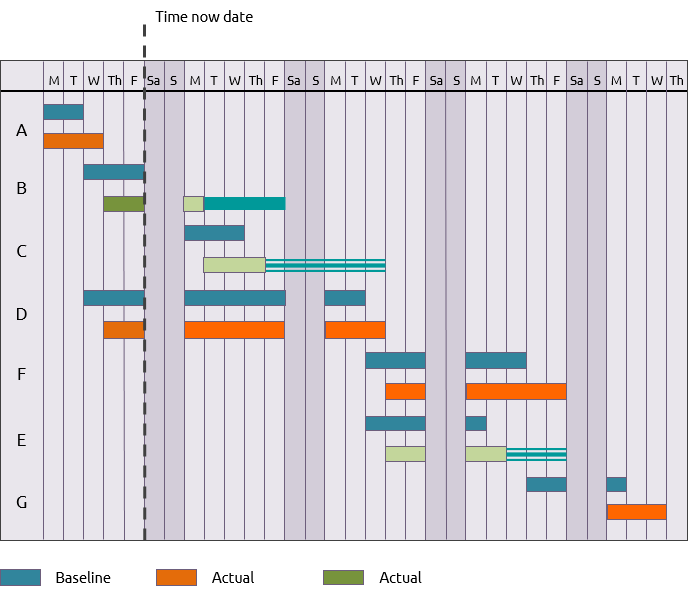
The ‘time-now’ date indicates the date at which progress was measured. Bars in the past are generally shown in a darker colour than those in the future.


