In 1906 Vilfredo Pareto observed that 80% of the land in Italy was owned by 20% of the population. The principle was adapted to quality management by Joseph Juran who observed that 80% of the faults in a system arise from 20% of the causes.
It was Juran who is credited with coining the term ‘the 80-20’ rule. In P3 management this can be applied as a rule of thumb that helps the team focus on the ‘vital few’ in terms of stakeholders, risk events or suppliers to name but three.
 Pareto analysis is used to identify what contribution the individual components of a system make to the whole system. It often reveals that 80% of effect is created by 20% of causes, e.g. 80% of the cost of mitigating risks events arises from 20% of the risks identified or 80% of the value is received from 20% of benefits. In Pareto analysis, a table is created of causes and their frequency.
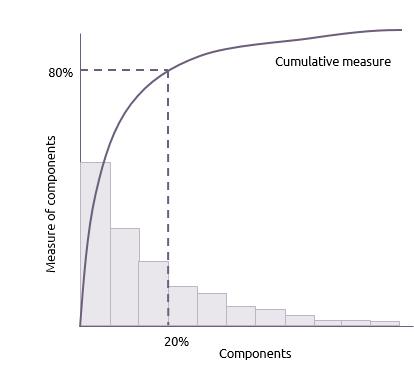
The causes are arranged in decreasing order and a cumulative figure created. The results are presented in a Pareto diagram, which shows the relationship between cause and effect in terms of frequency. This combination of a vertical bar graph and a line graph shows the decreasing measure of each component and the cumulative effect of all components.


