RAG is an acronym for Red, Amber, Green and is a form of report where measurable information is classified by colour. For each colour there is some pre-determined action. This usually constitutes escalation to a higher level of management.
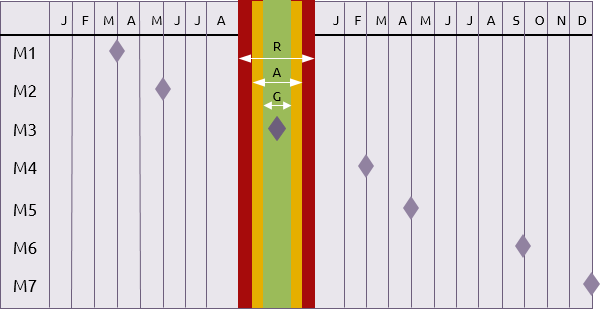
For example, if milestones are being tracked and the latest schedule indicates a milestone is within ±2 weeks of the baseline plan, then it may be considered green. If it is between ±2 and ±4 weeks of the baseline plan it is amber and if it is more than ±4 weeks from baseline then it is red.
In creating RAG reports there are three aspects that need to be decided (and usually set out in a control management plan):
- What will be monitored?
- What action should be taken in each case?
- What are the thresholds for green, amber and red?
What will be monitored?
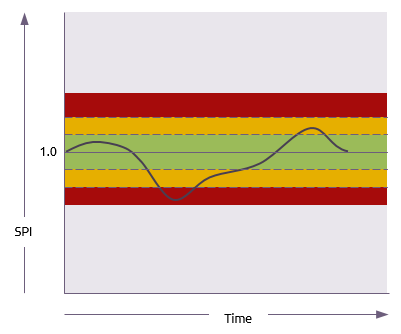 Any quantity may be tracked in this way. The art is to select key indicators that are appropriate to the context of the work. For example, a milestone schedule is applicable to any degree of complexity of work but something based on the schedule performance index (SPI) from earned value management would only be appropriate to more complex projects with sophisticated reporting mechanisms.
What action should be taken in each case?
The control management plan may set out guidelines such as:
-
Green: the project is on target and no escalation is required by the management team
-
Amber (moving towards red): the project is deviating from target and the management team should notify the sponsor at the next opportunity.
-
Amber (moving towards green): the project is returning to target and the management team should notify the sponsor in the next progress report.
-
Red: The sponsor should be notified immediately with recommendations for corrective action.
These guidelines should be seen as indicative and must be supplemented with the expert interpretation of each individual situation by the management team. This approach may also be used as part of the probability/impact assessment of risk events.
What are the thresholds for green, amber and red?
These will be set according to numerous possible factors, including the:
- sensitivity of the key indicator being monitored;
- relative experience and expertise of the P3 manager;
- the importance of the project or programme to the business.
Upper and lower thresholds do not have to be equally spaced from the baseline. Typically the threshold for progress that is behind or below target will be tighter than the threshold for progress that is ahead or above target.


