Assessing the progress of activities through ‘time spent so far’ or ‘money spent so far’ is usually misleading. Earned value calculations assess the value of work that has been done at a particular point and express that in proportion to the value of what should have been done by that point.
This can be illustrated by considering a very simple ‘project’ – building a brick wall.
A customer has employed a bricklayer to build a wall. It contains 1,000 bricks that the bricklayer estimates will cost 50p each (total cost of materials - £500). He is going to charge £50 per day for the estimated 10 days of work (total cost of labour - £500). So the total cost of the wall is £1,000.
In earned value management terms this expected cost is the ‘planned value’ (PV). The wall is deemed to have a value of £1000.
The customer has agreed to pay for the wall in two instalments of £500, one after 5 days and the other on completion in 10 days’ time.
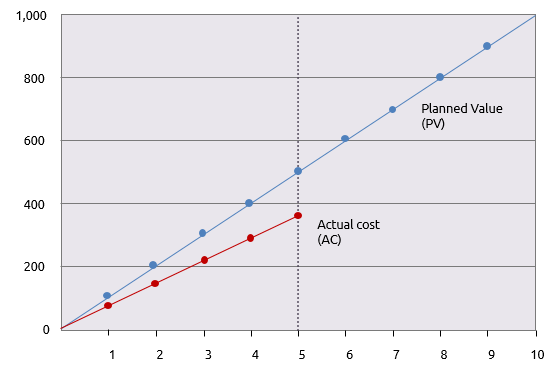
After five days the customer receives a bill for £375. This is the ‘actual cost’ (AC) of work done in 5 days.
The customer calls the bricklayer to ask how things are going; “half way there” is the reply and the customer’s first reaction is “great”; the bricklayer must have got the bricks cheaper than estimated.
A graph shows how actual expenditure is running below planned expenditure and a simple prediction shows a final cost of £750.
But is this really good news? The customer is not totally convinced and visits the wall just to be sure.
To his horror he finds that only 250 bricks have been laid. Based on the original estimate of £1,000 for a wall of 1,000 bricks, the ‘value’ of each brick laid is £1. The value of the work done so far is therefore only £250. This is the earned value (EV) and can be added to the graph.
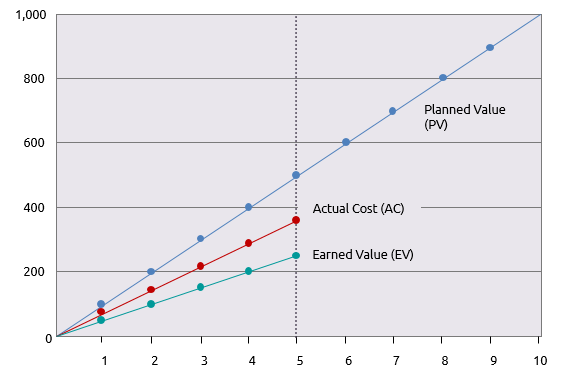
Not only has the work so far cost £375 for the number of bricks that should have cost £250, but only a quarter of the wall has been finished when it should have been a half.
To understand what is happening two aspects of the work need to be quantified. Schedule variance (SV) is a measure that indicates whether work is ahead or behind schedule. Cost variance (CV) is a measure that indicates whether the work that has been done is over or under budget.
The schedule variance is the value that has been earned by day 5, less the value that should have been earned by day 5, i.e. EV – PV
250 – 500 = -250
The cost variance is the value of work done – actual cost of achieving it, i.e. EV – AC
250 - 375 = -125
Both are negative indicating that the project is both behind schedule and exceeding budget.
While variances of -250 and -125 are significant on a £1,000 project, they would not be significant on a £1 million project. It is also useful to to understand the implications this has for the future progress of the project.
Both these issues are addressed by calculating two indices.
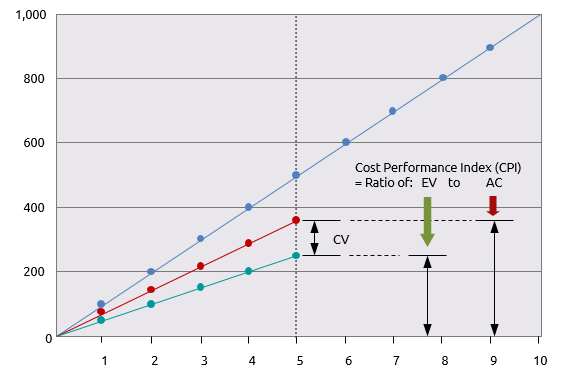
CPI is the ‘cost performance index’ which is calculated as: CPI = EV/AC
SPI is the ‘schedule performance index’ which is calculated as: SPI = EV/PV
The CPI for the wall is: 250/375 = 0.67
The SPI for the wall is: 250/500 = 0.5
These indices indicate the cost and schedule variances in proportion to the scale of the work done on the project so far. The next diagram shows this in a more graphical form for the CPI.
The next stage is to predict where the project’s current trend will lead. Two projected figures are calculated: the estimated cost at completion (EAC) and the estimated time at completion (ETC).
The EAC is calculated simply by dividing the original project budget or ‘Budget at Completion’ (BAC) by the CPI.
In the case of the brick wall, our projected final cost, based on progress by day 5 is:
EAC = BAC/CPI
or 1,000/0.67 = £ 1,493
A similar calculation is performed to estimate the ETC. This time the original duration (OD) is divided by the SPI.
ETC = OD/SPI
or 10/0.5 = 20 days
Therefore, based on current progress the project is predicted to cost £1,493 and take 20 days.
The key advantages of earned value management are that it gives a view of how the work is progressing and enables this to be used in estimates of the eventual cost and duration of the project. The basic calculations shown are quite simplistic and not sufficient if the project is complex.
They don’t take into account the difference between progress for critical activities and non-critical activities or the impact of some costs being variable and others being fixed. Complexity such as this would require a more sophisticated approach to earned value management.


