Every risk event, whether it is a threat or an opportunity, has two characteristics: the probability that it might happen and the impact it would have if it did happen.
Even on the simplest of projects, risk events should be assessed for their probability and impact using a scale such as high, medium and low. As the complexity of the work increases, the sophistication of the assessment should increase.
A thorough assessment of risk events for projects of higher complexity and for programmes would have a five point scale with guidelines and numerical values for each point on the scale.
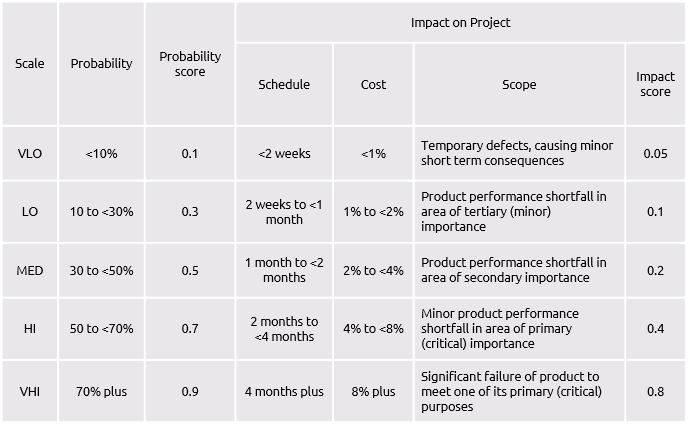
The example below applied to threats and is adapted from the APM’s PRAM Guide1.
This ‘risk criteria table’ provides numerical ranges for the probability scale from very low (VLO) to very high (VHI).
It also provides impact criteria in the three elements of the triple constraint. Clearly, the guidelines for what constitutes high or low are not universal. A two month delay on a six month project is very different to a two month delay on a three year project.
All the impact indicators in the table need to reflect the risk context of the work and in particular the risk appetite of the host organisation. These indicators will be defined according to the context of individual projects and programmes, and set out in the risk management plan.
The probability and impact scores are used to arrive at overall values for ranking the risk events. For example:
- A risk event of low probability (0.3) and high impact (0.4) would have a ranking value of 0.3 x 0.4 (0.12).
- A risk event of high probability (0.7) and low impact (0.1) would have a ranking value of 0.7 x 0.1 (0.07).
Interestingly, a risk event that is low probability/high impact has a different score than high probability/low impact. This is because probability scores are defined on a linear scale while impact scores are on a logarithmic scale. The effect of this is to put more emphasis on impact than on probability.
If all the possible combinations of ranking value are calculated for both threats and opportunities the table below is formed.
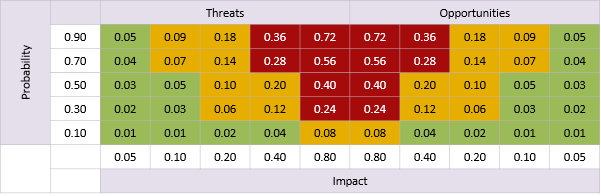
This can be presented in a RAG format with associated guidelines as to how each event should be managed according to its red, amber or green status.
The guidelines for scales, scores and status should be set out in the assessment section of the risk management plan.
- Association for Project Management(2007), Project Risk Analysis and Management Guide, High Wycombe


