Monte Carlo analysis uses a three point estimate of the duration for each activity in a network diagram. It then performs multiple critical path analyses to arrive at a range of probabilities for a project schedule.
The table below shows the three point estimates for seven activities.
| Task | Optimistic | Most likely | Pessimistic |
|---|---|---|---|
| A | 2 | 2 | 8 |
| B | 4 | 5 | 12 |
| C | 7 | 8 | 15 |
| D | 10 | 14 | 18 |
| E | 6 | 7 | 14 |
| F | 7 | 9 | 17 |
| G | 2 | 3 | 10 |
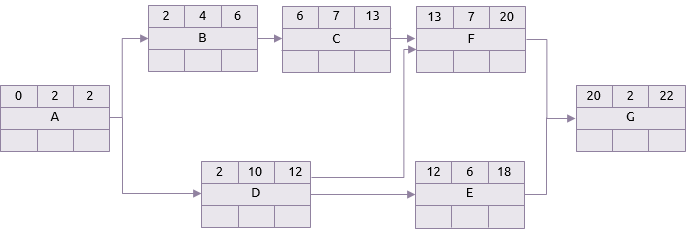
In practice, any one of the activities in the table above could take anything between its optimistic and pessimistic durations. The two networks below show the difference between a scenario where all the activities take their optimistic durations and one where they all take their pessimistic durations. For clarity only the forward pass of the critical path analysis is shown.
Optimistic scenario
Pessimistic scenario
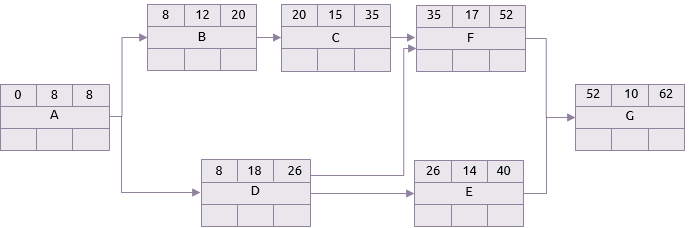
This project could, therefore, take anything between 22 and 62 days but these two extremes are the most unlikely scenarios. In between are numerous others. Monte Carlo analysis randomly chooses durations for each task from the specified ranges and then performs a critical path analysis.
This can be done any number of times and computer packages that support this generally recommend that 250 - 1,000 iterations will give an accurate distribution for the project’s duration. The more complex the project and the greater the spread between optimistic and pessimistic durations, the more iterations will be required.
Plotting the frequency of each possible project duration, typically results in a roughly normal distribution.
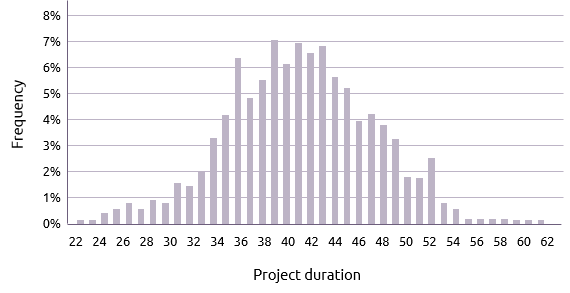
The mean duration for the project, from the above graph, seems to be approximately 42 days. That means there is a 50% chance of finishing by day 42.
A more accurate indication can be derived by plotting the cumulative curve shown below.
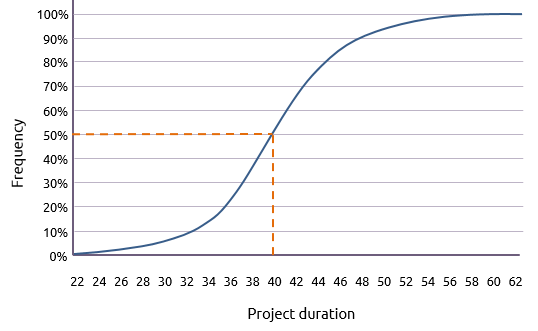
From this, a variety of questions can be answered. For example:
"What day is there a 50% chance of finishing by?"
The graph indicates that the answer is day 40 (to the closest day).
Conversely:
"What chance is there of finishing by day 40?"
The answer, of course, is 50%
Having performed Monte Carlo analysis there is unlikely to be a single critical path. It is therefore essential to know the ‘criticality’ of activities, i.e. the frequency with which they appear on a critical path.
If 1,000 iterations were done, it may be that there are three possible critical paths. The first occurs 600 times, the second 250 times and the third 150.
If this were the case, all the activities that occurred exclusively on the first critical path would have a ‘criticality index’ of 0.6. Activities that were on the second and third only would have criticality indices of 0.25 and 0.15 respectively. An activity that was on both the first and second critical paths would have an index of 0.85, and so on.
There are many alternative distributions than can be used for the activity durations in a Monte Carlo analysis, of which four are shown below:
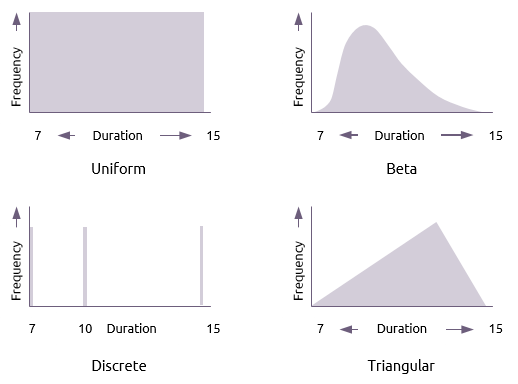
- Uniform
-
A uniform distribution gives any duration in the range an equal chance of occurring.
- Beta
-
This distribution places an emphasis on the most likely estimate and is the one used in PERT analysis.
- Discrete
-
A discrete distribution lists the limited number of durations that the activity could have. In this case the activity duration could be either 7 or 10 or 15 and nothing else.
- Triangular
- This places equal emphasis on the three estimates. The formula for calculating the mean in this distribution is: