Preparing Gantt charts


This worked example requires that you have read, understood and have the results from the critical path analysis worked example.


Activity 1


Use the solution from the critical path analysis worked example to draw a Gantt chart using the template opposite.


Hints:

  • Highlight the critical activities in a different colour (the convention is red)
  • Try showing free float and shared float separately.


This example shows the resuting Gantt chart using only the numbers from the analysed network.

The distinction is made between free and shared float.


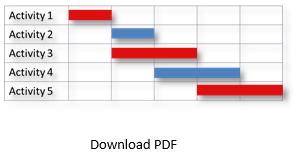
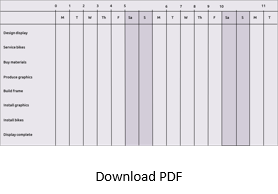
This example shows how the calculations from the anaysed network are converted from numbers to calendar dates.


SHARE THIS PAGE

Please consider allowing cookies to be able to share this page on social media sites.

Change cookie settings
No history has been recorded.
Back to top