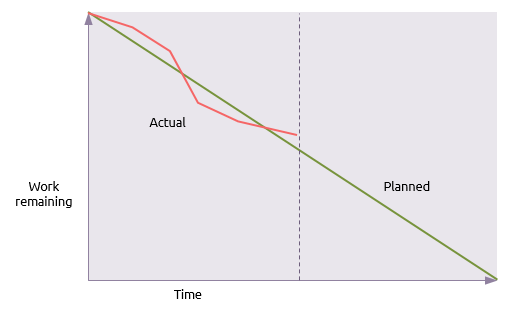
A burn down chart is a graphical plot of work remaining against time. The simple psychology of the chart is that it focuses the mind on what is left to do rather than what has been achieved. While an appreciation of what has been done creates feelings of satisfaction, an appreciation of what is left to do creates a feeling of urgency.
The vertical scale can be measured in various units. It could be effort (hours or days) or products delivered. Some agile approaches use ‘story points’ on this scale.
Burn down charts are commonly used in agile approaches where they cover a single timebox (or sprint). In this case the timescale will be short (typically 2 to 4 weeks) and there the chart creates a real sense of what needs to be done before the sprint is finished.
The principle of burn charts could be used in conjunction with other techniques such as the consumption of buffer time in critical chain schedules.


