Brooke Bicycles has recently moved to new office and manufacturing facilities. A display of historic bicycles is to be assembled in the reception area. The activities to be done have been identified.
First, the display has to be designed following which the selected vintage bikes will be serviced and the building materials bought. The frame of the display can then be assembled.
The backdrop will contain photos of the bikes being serviced. Once the bikes have been serviced and photos taken, the large graphic panels can be produced which are then installed on the completed frame.
The bikes themselves can also be installed when the frame is complete. Once the graphics and bikes have been installed the display is complete.
The activity list is: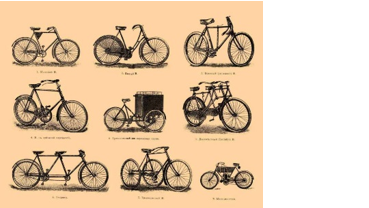
- Design Display
- Service Bikes (includes photography)
- Buy Materials
- Produce Graphics
- Build Frame
- Install Bikes
- Install Graphics
- Display Complete
| Activity 1 |
Take a sheet of paper and draw a precedence network from the above information. Hints:
|
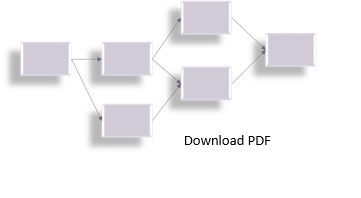 Click on the graphic to download the sample network. Don’t compare your network to the sample and assume yours is wrong if they aren’t the same.
The chances that our networks look the same are slim. Apart from the fact that we may have arranged the activity boxes differently, we may also have interpreted the text of the case study differently.
Any verbal or text description of how the activities can be performed is likely to be ambiguous and two planners are likely to see different ways of performing the work.
Once the network diagram is drawn, there is no doubt about the sequence of working. A picture speaks a thousand words.
This simple example only uses finish-to-start dependency links but you can use others to model more complex relationships using start-to-start and finish to finish links (see precedence diagram)
| Activity 2 | |||
Use the example solution from activity 1 to have a go at critical path analysis (including the forward pass, backward pass and float calculations). Mark the critical path on your diagram. The activity durations (in days) are:
| |||
Design Display | 3 | Build Frame | 4 |
Service Bikes | 2 | Install Bikes | 2 |
Buy Materials | 2 | Install Graphics | 1 |
Produce Graphics | 2 | Display Complete | 0 |
Hints:
| |||
Click on the graphic to download the answer. This time, your calculations should be the same as those in the answer.
A final thing to note on the completed network is the float on 'Produce graphics'. The total float is calculated as 3 days.
However, while 'Produce graphics' could finish as early as 7, it's succeeding activity 'Install graphics' cannot start any earlier than 9.
This means that 'Produce graphics has 2 days of 'free float', i.e. it could be delayed by 2 days without having any impact on any succeeding activities.
What next?
This will enable you to see how the numbers in this CPA calculation are converted to dates to represent a real world schedule. |
Further reading
A pdf article that provides more detail on a wider range of network calculations. | |
An article warning of the dangers of schedules not based on logic. | |
An overview of the factors that make a schedule 'usable' | |
The concept of ‘float’ is less than 60 years old. The key question posed by this post is if schedule float did not exist before 1957, how real is it today? |


