
Initial research for Brook Bicycles's Columbus project has identified three possible locations for a new retail outlet. Click here to download a PDF of the background to the project and the basic financial data relating to the three locations.
The Cascades
The table below takes the financial data for the Cascades development and calculates the net cash flow for each year and the cummulative cash flow over five years. All figures are in thousands.
| A | B | C | D | E |
|---|---|---|---|---|
| Year | Income | Expenditure | Net cash flow (B-C) | Cumulative cash flow (E from previous year + D) |
| 0 | 0 | 595 | -595 | -595 |
| 1 | 900 | 500 | 400 | -195 |
| 2 | 954 | 544 | 410 | 215 |
| 3 | 1,011 | 575 | 436 | 651 |
| 4 | 1,071 | 600 | 471 | 1,122 |
| 5 | 1,136 | 650 | 486 | 1,608 |
If these figures are plotted on a graph it is clear that the payback occurs after about 18 months. To be precise, the payback is:
Payback period = 1 + (195/410) or 1.48 years (a week short of 18 months)
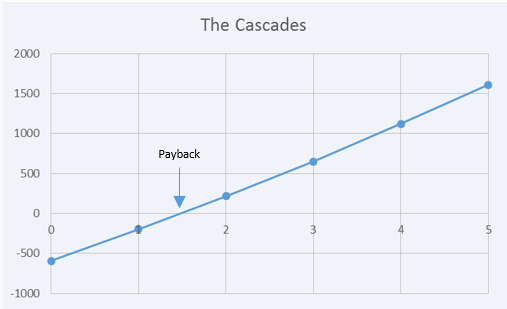
This approach only plots the net cash flow unlike the examples in the encyclopaedia example which plot both income and expenditure.
What next?
This activity takes the appraisal one step further by discounting future costs and revenues to calculate a present value. |


