In its simplest form an influence diagram is decision support tool comprising a series of linked nodes. There are various conventions around the shape and colour of the nodes but a basic influence diagram comprises arrows and three shapes.
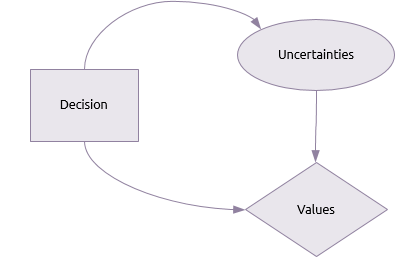 Rectangles indicate decisions or things that are controllable. Ovals represent uncertainties and diamonds represent values or the required outputs of the system being modelled. Arrows show the way these nodes influence each other. Unlike network diagrams, the arrows do not represent dependencies or flow of time – they are purely indicators of influence.
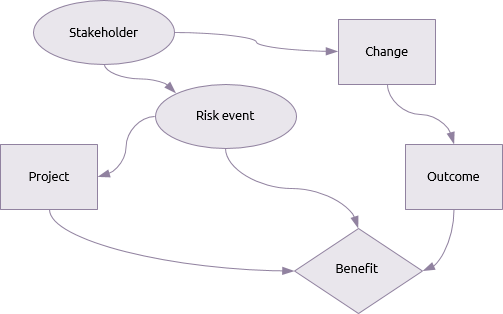
The basic principles of influence diagrams can be adapted to different parts of a P3 ‘system’. For example, decisions could be interpreted as projects, change or outcomes, ovals could be interpreted as risk events or the actions of stakeholders. Values would typically be the benefits to be delivered.
A general form of P3 influence diagram may therefore appear as shown below.
As a project or programme becomes more complex it would become increasingly difficult to show the many inter-relationships on a single diagram. One approach is to restrict influence diagrams to one particular aspect of the work, such as relationships between projects, outcomes and benefits; relationships between outputs and risk events or relationships between projects and stakeholders. The possible combinations are endless and there will be links between different influence diagrams that may be shown with interface nodes (in the shape of a hexagon for example).


